
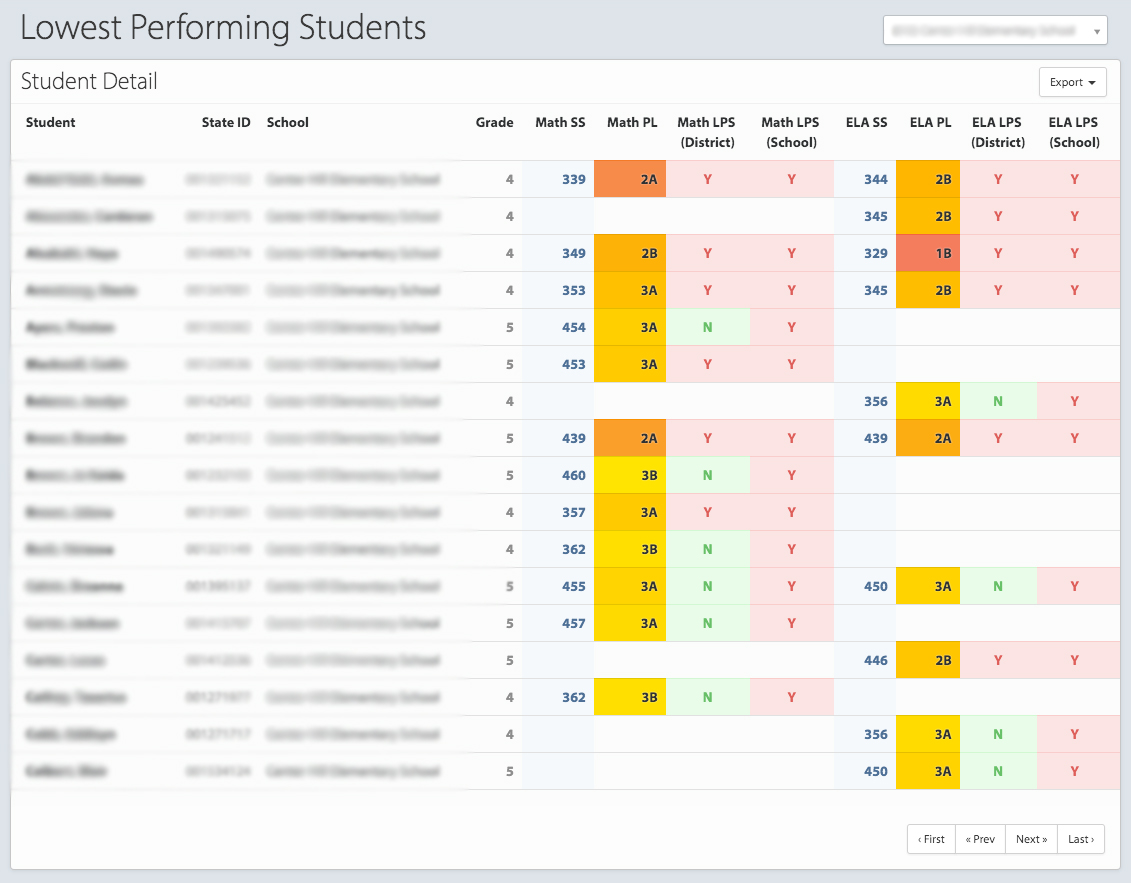
For our Mississippi users, you will find the Lowest Performing module on your left menu under Accountability. The data you can find in this module includes:
Student Name
State ID
School (Current)
Grade (Current)
Math SS (Scale Score)
Math PL (Performance Level)
Math LPS (Lowest Performing Students) District
Math LPS (Lowest Performing Students) School
ELA SS (Scale Score)
ELA PL (Performance Level)
ELA LPS (Lowest Performing Students) District
ELA LPS (Lowest Performing Students) School
A few details you'll need to know when accessing this data:
- These students are projected based on current enrollment and are recalculated daily.
- Students may enter and exit this dataset as enrollment changes.
- Students in this module may not necessarily be considered the lowest-performing students for the 2020 MAAP test.
- Data is calculated based on students' 2019 MAAP scores, which will be used next year to calculate growth compared to 2020 MAAP scores.
For district-level users, use the school drop-down to quickly see school data.
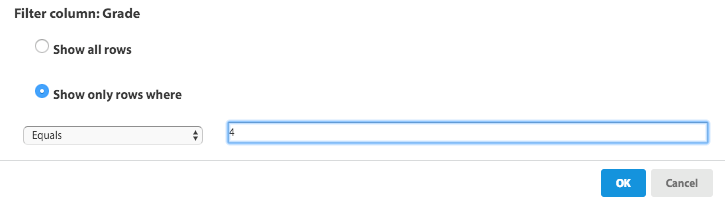
Any user can use dynamic sorts and filters. For example, let's filter down to just 4th graders at my school. Click the column heading titled Grade. Use the arrows to sort ascending or descending. Use the funnel to filter.

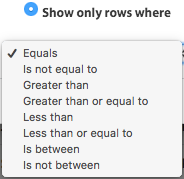
A box will emerge where you can select how you want to filter. For this example, I'll use 'show only rows where' and select 'equals'. Type a 4 and OK.
Note: You can filter based on other options. For instance, to see all the students with a Math SS of less than 400, select that column and filter by 'Less than or equal to' and enter 400.
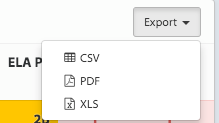
You can also export the results to XLS, CSV, or PDF for further analysis or printing. If you've sorted or filtered before you export, those sorts and filters will export with your data.
Now that you've identified the students, click on a student name to display the Student Card. From there you can see other data for these students, and make phone calls to students' contacts with a total of 3 clicks!